
Do lightweight pneumonia classifiers fail equally in both directions when they cross from one chest X-ray cohort to another? This MSc dissertation measures that directional asymmetry, in both discrimination and calibration, between the Kermany (China) and Togunwa (Nigeria) under-five cohorts.
The question#
To what extent is cross-population generalisation between the Kermany and Togunwa under-five chest-radiograph cohorts directionally asymmetric for MobileNetV2 and EfficientNet-B0, in discrimination and calibration, after controlling for source training-set size?
The aim was to find out whether transfer failure reflects a genuine difference in where the data came from, or an artefact of mismatched training-set sizes.
Data#
- Kermany — 5,856 images (5,232 train, 624 test) from Guangzhou, China; ages 1–5; expert physician labels.
- Togunwa — 190 images (93 normal, 97 pneumonia) from two sites in Ibadan, Nigeria; under-five; two-radiologist consensus labels.
- Musa — 2,600 images across four classes from Nigeria; mixed pediatric and adult; exploratory only.
The size gap drives the design. Togunwa has 190 images in total, so each seed takes a stratified 30-image holdout (15/15) and runs 5-fold cross-validation on the remaining 160, leaving 127–129 training images per fold.
Experimental design#
Design
Each architecture is evaluated in four conditions: two cross-population directions — K2N (train on Kermany, test on the Togunwa holdout) and N2K (train on Togunwa, test on the Kermany test set) — plus the in-domain baselines K2K and N2N.
Comparing K2N with N2K directly would be confounded, because the two target sets differ in difficulty. The primary outcome is a double difference instead:
Gap_K     = AUROC(K2K) − AUROC(K2N)
Gap_N     = AUROC(N2N) − AUROC(N2K)
Asymmetry = Gap_K − Gap_N
Kermany training sets are balanced 1:1 and strictly nested at 50, 100, and 190 images, so K2N has a genuine size curve. Size matching is only partial: N2K has a single reference point at Togunwa's own working-set size.
Metrics are AUROC, specificity at 95% fixed sensitivity, and expected calibration error (raw and bootstrap-debiased, with sample-size-scaled bins). Uncertainty comes from a run-level bootstrap, with an image-cluster bootstrap and a permutation test as independent checks, and DeLong and McNemar tests with Holm correction.
The correction#
The first version of the analysis was wrong, and fixing it is the centre of the project.
The original design used three seeds, a pooled-row bootstrap, no in-domain baselines, and a fixed 15-bin ECE. It showed an apparent discrimination null, with an interval of [−0.055, 0.110]. Supervisor review identified three problems: the pooled-row bootstrap resampled correlated prediction rows as if they were independent (pseudoreplication), which gave falsely narrow intervals; the missing baselines meant a raw cross-direction comparison was confounded by target difficulty; and ECE is biased at small sample sizes.
I added the K2K and N2N baselines, moved to a run-level bootstrap that resamples whole runs, debiased the ECE, and raised the seeds from three to six. The corrected analysis reversed the headline: the null became a reliable asymmetry.
I also narrowed the size question. A matched 50-image N2K condition would leave about ten images per fold given Togunwa's 190-image ceiling, which I anticipated (but didn't test) would give noise-dominated estimates.
Results#
Discrimination: a reliable asymmetry#
95% CI [0.125, 0.351] · p = 0.0066
0.233
MobileNetV2 — asymmetry
95% CI [0.328, 0.530] · p = 0.0027
0.444
EfficientNet-B0 — asymmetry
| Architecture | Gap_K | Gap_N |
|---|---|---|
| MobileNetV2 | 0.321 [0.256, 0.385] | 0.087 [0.008, 0.160] |
| EfficientNet-B0 | 0.377 [0.301, 0.435] | −0.067 [−0.105, −0.023] |
Moving from Kermany to Togunwa costs far more AUROC than moving the other way, and Gap_K is positive in every seed for both architectures. The p-values come from the permutation test.
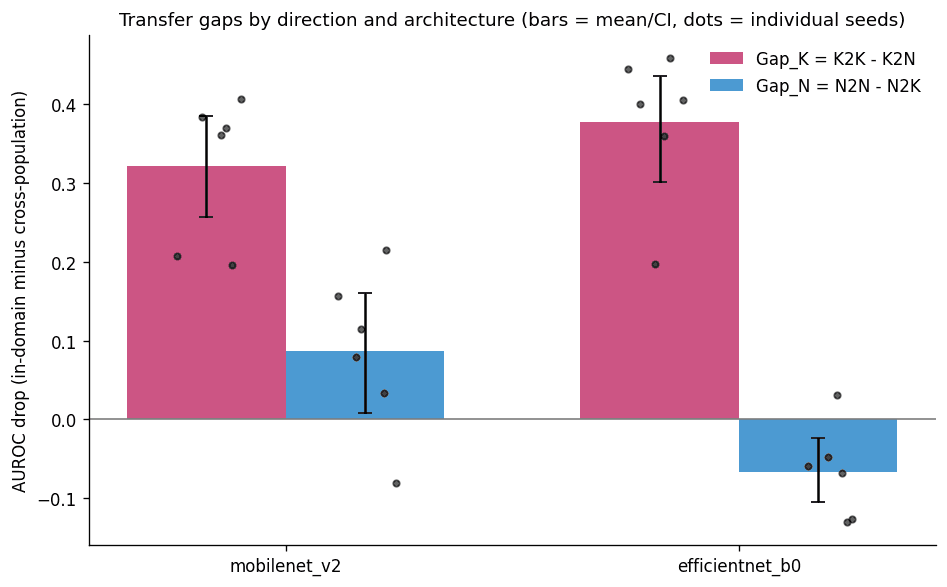
One counterintuitive pattern: EfficientNet-B0's N2K AUROC (0.730 [0.683, 0.776]) exceeds its own N2N baseline (0.664 [0.623, 0.702]), giving a negative Gap_N. It holds in five of six seeds — a majority, not universal. EfficientNet-B0 also significantly outperforms MobileNetV2 on N2K (DeLong and McNemar, Holm-corrected).
Calibration: in-domain vs cross-population#
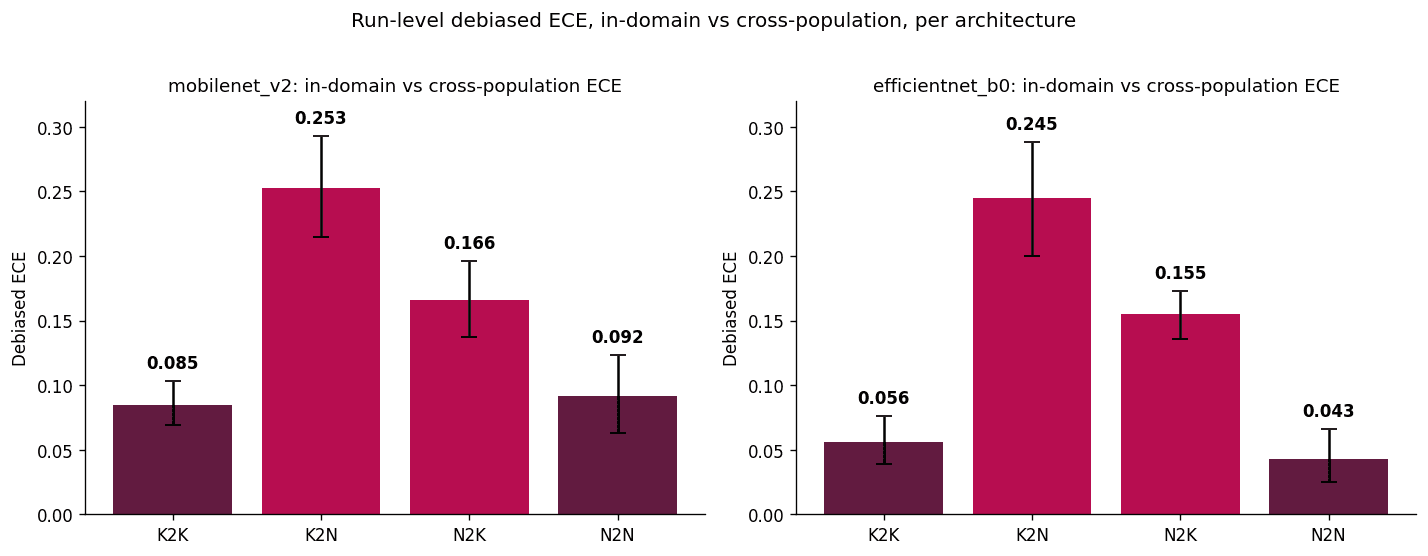
Debiased ECE sits around 0.04–0.09 in-domain and 0.15–0.26 cross-population, for both architectures.
Training-set size#
K2N AUROC is roughly flat across 50, 100, and 190 Kermany images — MobileNetV2 0.647 / 0.631 / 0.656 and EfficientNet-B0 0.574 / 0.581 / 0.610 — and the asymmetry is already present at 50 images.
Exploratory: the Musa cohort#
Training on Kermany and testing on Musa reproduces the degradation (K2M AUROC 0.718 for MobileNetV2 and 0.818 for EfficientNet-B0), but with much higher run-to-run instability: individual MobileNetV2 K2M runs range from 0.220 to 0.929. Musa mixes pediatric and adult images, so these results are reported separately from the core findings.
Limitations#
- Kermany contains 27 confirmed near-duplicate groups and multiple images per patient, a leakage risk.
- Specificity at 95% sensitivity rests on about 15 positive Togunwa cases.
- The cohorts differ in scanner, protocol, and labelling as well as demographics, so a demographic effect can't be isolated.
- EfficientNet-B0's negative Gap_N is a majority pattern, not a universal one.
- The full size × direction interaction is untestable with Togunwa's 190 images.
- Musa is exploratory, mixed pediatric and adult, and highly unstable.
Ethics and AI use#
The study uses secondary public data only, under UREC 1 (research with no human participants), with model cards following Mitchell et al. (2019). AI use was declared at AITS Level 2: Microsoft Copilot for literature discovery, and Anthropic's Claude as a thought partner for exploring methods and for copy-editing. All code, pipelines, statistics, and experiments are my own.
Code#
Ten sequenced notebooks — verification and EDA, splits, training, inference, discrimination, calibration, size interaction, significance, the Musa extension, and aggregation — import a shared src/ package, with every path and design constant in config.py. Raw images never enter the repository; splits are stored as manifests.
codenameberyl/crosspop-cxr-asymmetry
GitHub
Evaluation framework: 72-fit training grid, run-level bootstrap, debiased ECE, significance tests, and model cards.